Managing the Information Load
Start writing, no matter what. The water does not flow until the faucet is turned on.
– Louis L’Amour
Introduction
This lesson introduces techniques for managing large quantities of information. Here you will learn how to decide on what data to include, where to place it, and how to present it in verbal or graphic form.
The problem with data
The problem with data is that there’s so much of it!
Two kinds of decisions on information
The basic principle guiding you in selecting information is the need to know. When making judgments about selecting information, bear in mind that this principle applies on several levels. You have to judge:
- Do the committee members need to know this information; or,
- Do they just need to know that Management knows this information?
In the first case, including the information, either in the paper or in an annex.
In the second case, don’t include the information. Convey Management’s knowledge in some other way, e.g., by reporting that an investigation has been carried out.
The role of annexes
Writers commonly see annexes as serving two functions:
- They provide information for those readers who are closely involved in the case.
They indicate to committee members that Management has adequately prepared the case they are arguing.
Brief check
The second function leads to danger. There is a temptation to think that having more information leads to a more persuasive case. This is not true.
Excess information obscures an argument. Specify the minimal amount of information that the readers need to believe your claims and support your judgments.
To do this, you will find it useful to follow the Pyramid Processing approach, based on three different classes of readers.
Pyramid Processing
Information overload can be avoided if you plan your information content using Pyramid Processing.
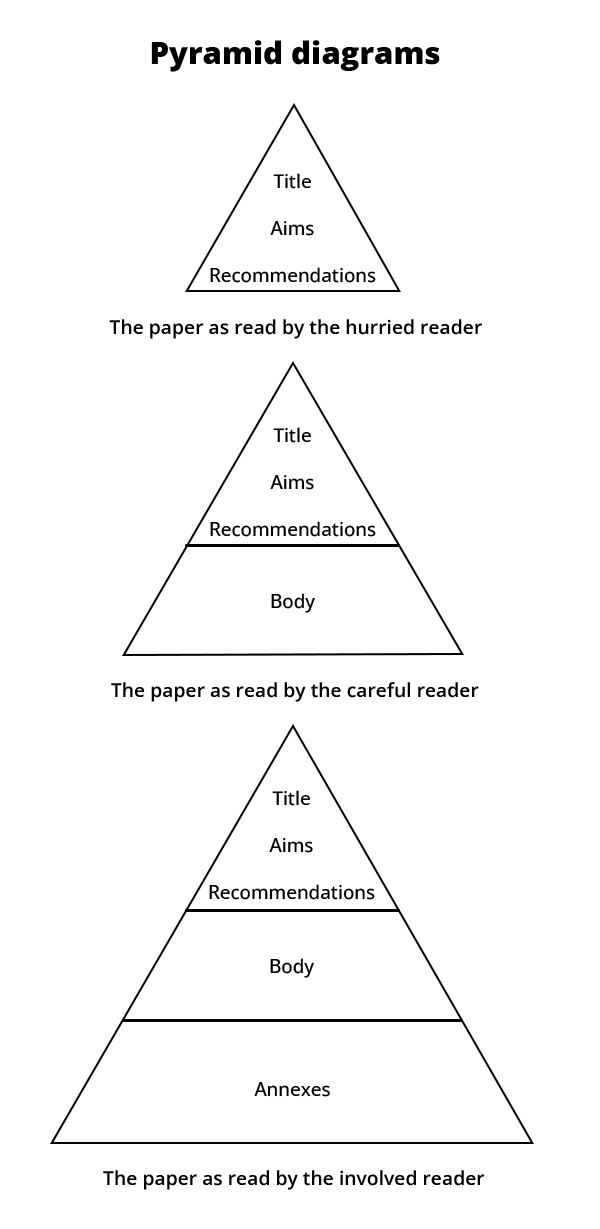
Pyramid Processing is a way of writing three papers in one document—three papers, each meeting the information needs of a different kind of reader.
Reading is not a linear process. Readers seldom “start at the beginning, go on to the end and then stop”. Instead, they jump about in a document. Also, many readers will not read everything you write. You have to arrange the information in a ‘layered’ way so that readers can go as deeply into the issue as they feel is necessary.
The hurried reader
A typical pattern for reading papers is to look at the title and the aims first but then jump to the end to check the recommendations. A hurried reader pressed for time may stop here and read no more. But note that the main message has already gotten across!
The careful reader
A more careful reader may go back to read through the body of the paper, following the argument through to the end but not checking the data in the annexes. These readers also get the message but in more detail. They get the main message, the line of reasoning, and the essential evidence.
The involved reader
A reader with close involvement with the case will also check some (or all) of the data in the annexes as they go through the argument. Only a very dedicated reader will read every word in the paper and the annexes, but the information must be there just in case.
The following pyramid diagrams show how information load can be structured to help any kind of reader.

Writing callouts
Every annex must be referenced in the text with a callout, i.e., a phrase or sentence that directs the reader to the annex. Here are examples of some different language forms used for callouts.
Direct instruction
[statement], see Annex A for descriptions and Annex B for plans.
Subject first (usual)
Subscription rates for the last five years are shown in Annex A.
A breakdown of costs is attached at Annex A.
The legal opinion is attached as Annex A.
A detailed comparison is given in Annex A.
An analysis of imports is detailed at Annex C.
A breakdown of costs is at Annex B.
Subject last (rare)
Annex C shows/gives/details the subscription rates and admission fees.
This is a less usual structure because the start of a sentence usually refers to information that is already known by the reader. To understand why review the discussion of known-new theory under Be coherent in Section Seven Style.
Embedded
In Management’s view the current retirement policy, which is shown at Annex A, is too kind, especially when taking into account …
Based on the available statistics, shown at Annex B, it is estimated that this change will bring about an additional 31 retired horses.
Graphic displays
“Words are not graphical. Charts and coloured graphs in annexes or the main body
of the paper are very effective tools to present data.”
An IT Director
Brief check
An important paper can be made more persuasive by displaying data in graphic form. Charts and graphs give a simple visual display, which makes sense of complex data.
Follow two key guidelines when using graphics:
- Make each graphic illustrate one point in your data or one claim in your argument.
- Choose the right kind of graphic for the type of point you are making.
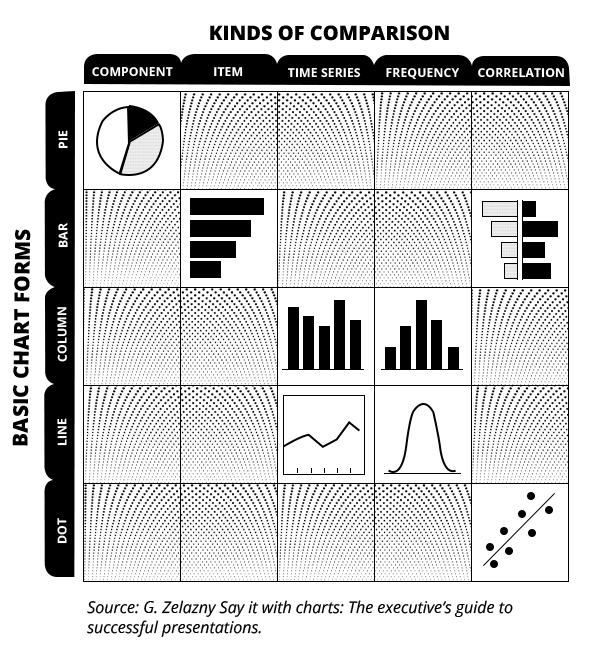
There are only five basic kinds of points each of which is based on a kind of data comparison. These are:
- componential analysis (breaking a whole down into parts)
- item comparison
- time-series
- frequency distribution
- correlation
Each of these is best illustrated with certain kinds of charts. The matrix below shows these relationships.

Keys to success
INCLUDE DATA ON A ‘NEED TO KNOW’ BASIS
DISTINGUISH BETWEEN ‘NEED TO KNOW’ AND ‘NEED TO KNOW THAT WE KNOW’
PUT ESSENTIAL INFORMATION IN THE BODY OF THE PAPER
PUT SUPPORTING DATA IN THE ANNEXES
USE GRAPHICS FOR GREATER CLARITY AND IMPACT
Dangers to avoid
INFORMATION OVERLOAD IN THE BODY OF THE PAPER
DENSE PARAGRAPHS FULL OF NUMERICAL DATA
DENSE TABLES FULL OF UNANALYSED DATA


